Logging
What logs stored in eramba
Introduction
eramba is composed of an application that runs on multiple containers (eramba, cron, MySQL, Redis).
Depending on what type of logs you would like to review you will need to look in one or another place. This also is affected by the type of installation you have, on-premise or SaaS.
Container
Those of you running eramba on-premise (SaaS customers do not have access to these containers) will be using our Docker install which includes multiple containers:
- eramba (where the app runs)
- mysql
- cron (where batch processes run)
- redis
You can access these containers and their respective logs like any other docker-based system:
docker logs container-name
For example, the following will show Apache logs in eramba:
docker logs eramba
Application Logs
eramba runs on top of the "eramba" container as a PHP application. eramba stores the following type of logs:
- Logs triggered by changes on any item on the system (risks, controls, etc.)
- Logs triggered by login actions (successful logins, failed logins, brute force attempts)
- Logs triggered by the application (errors, database, logins, etc.)
The following sections will explain where these logs can be found and what they tell you.
Activity Logs
Every change on every item on the software will be recorded, such logs are stored on the database directly and accessed through the interface. Please review the Activity Log documentation.
Login Logs
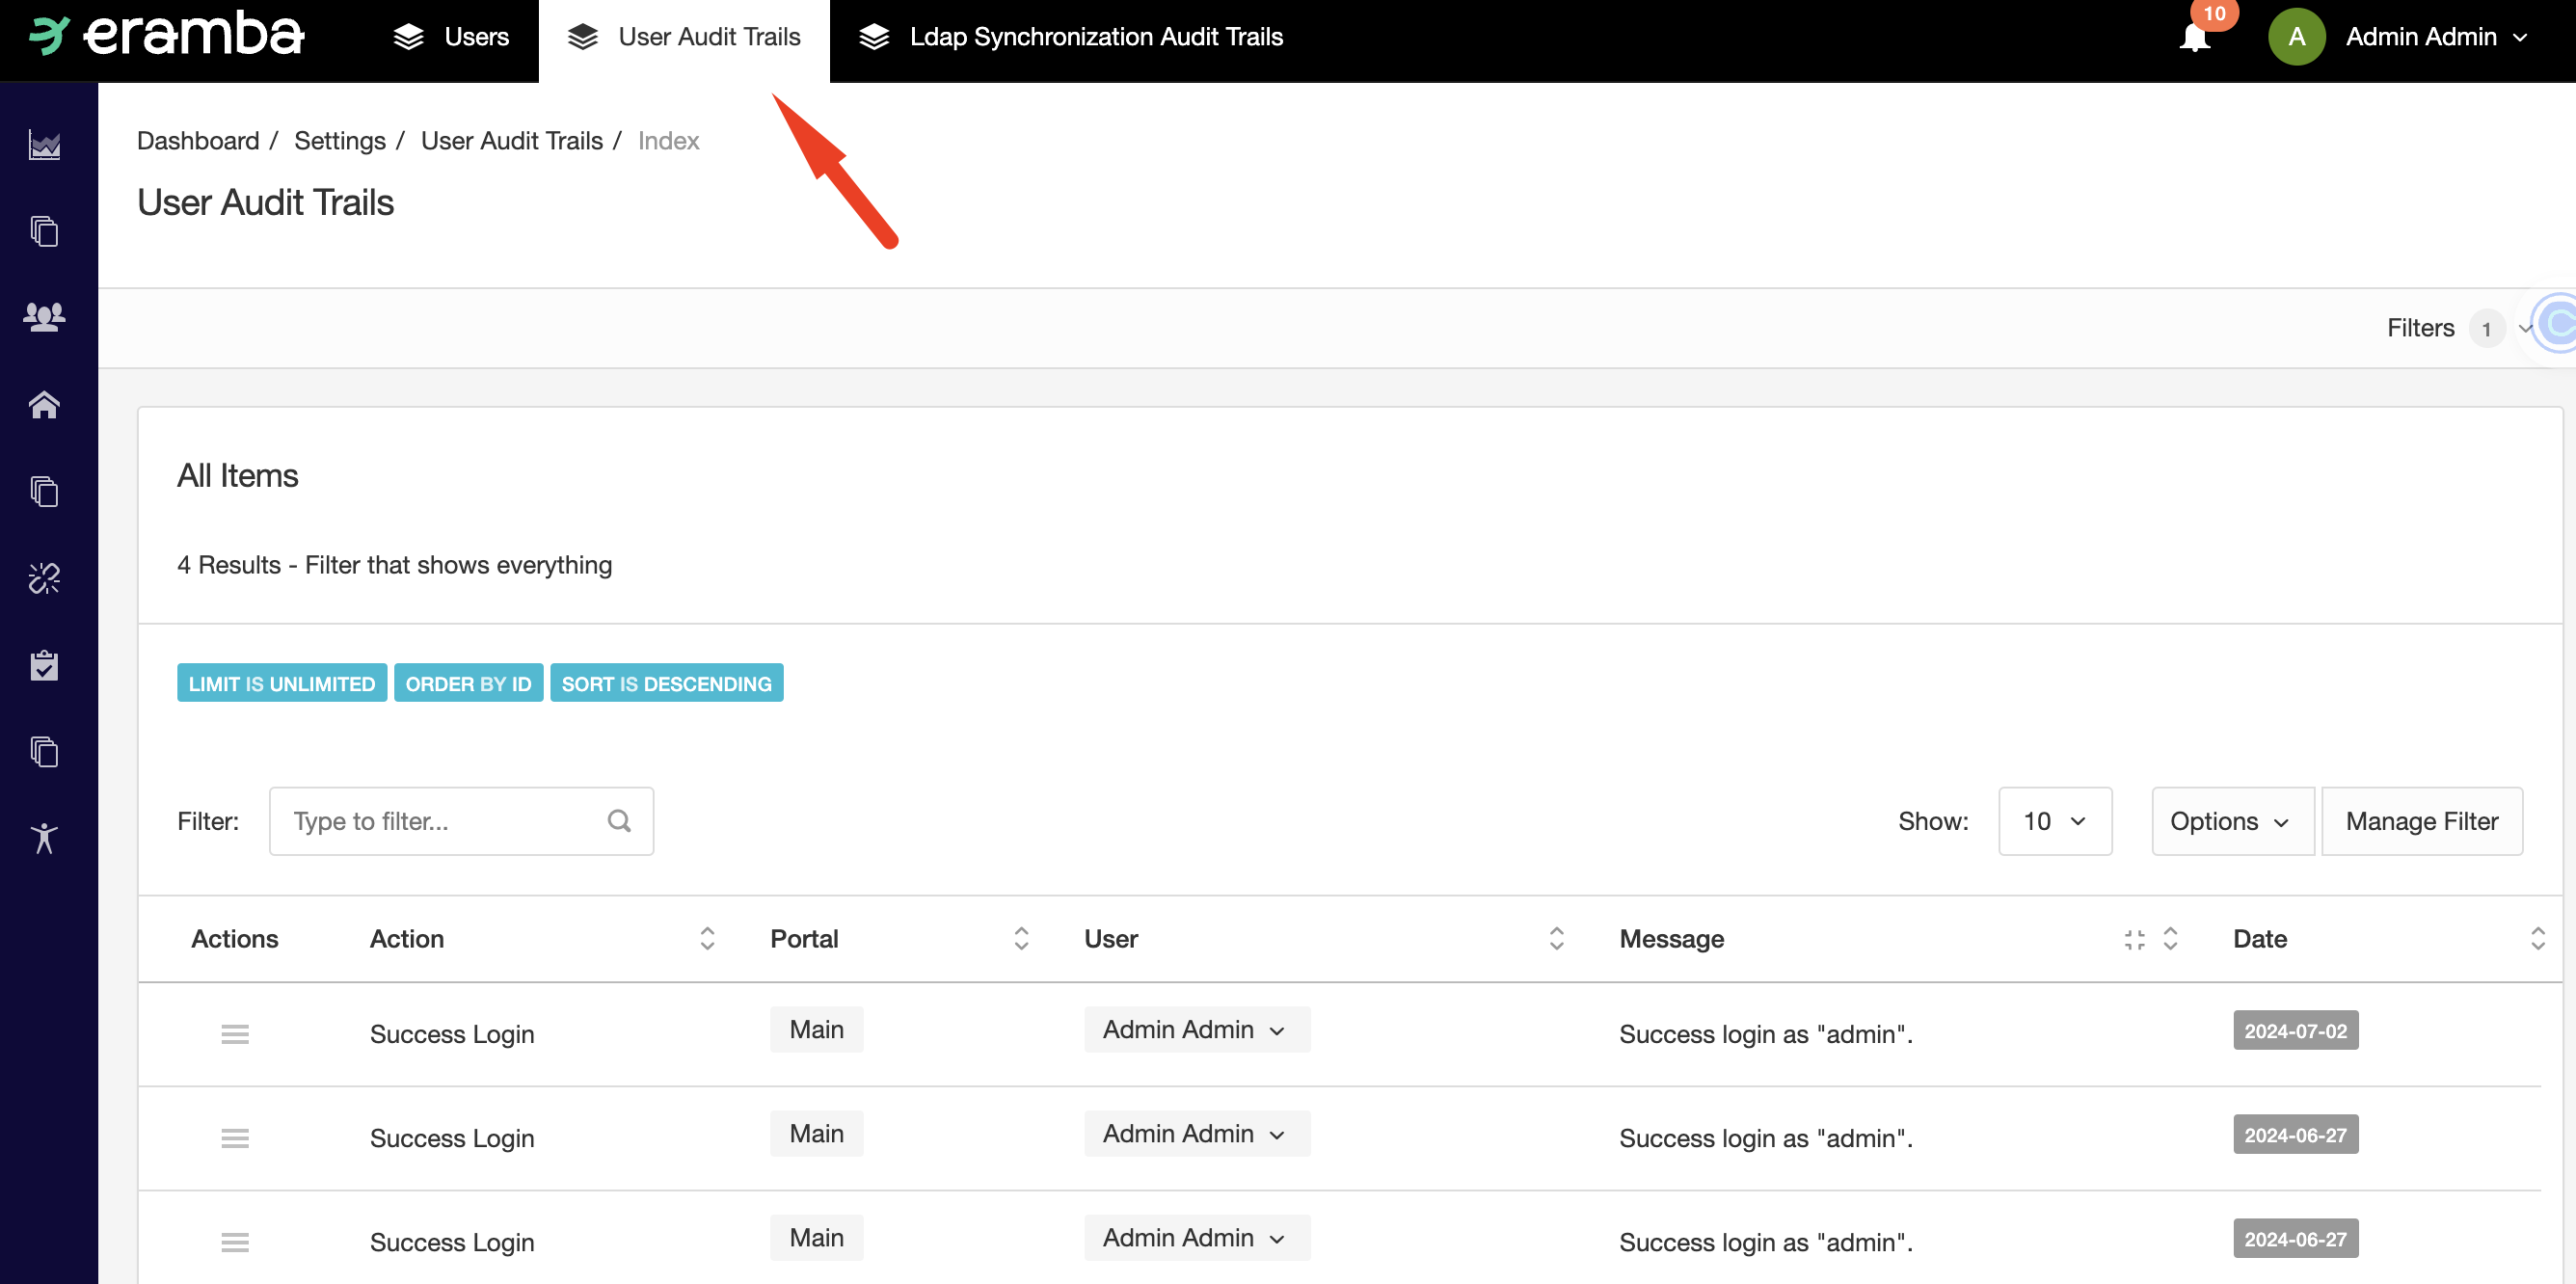
Under System / Settings / User Management, you will find a tab that allows you to access login records. These logs are stored on the database and are only accessible using the web interface.
Note: Only logins through local auth are stored in this section. If you are using a different authentication method (LDAP, SAML, Etc) then review the authentication.log file (refer to Core Logs) or look directly on the LDAP/SAML or Oauth provider side.
Core Logs
These logs are text files you can access using the web interface at System / Settings / Error Logs and Diagnostics.
At times, when customers have problems with the application, our support teams might need these logs and therefore we might ask customers to click on "Send Logs and Diagnostics" so we receive these logs to determine what could be going on.
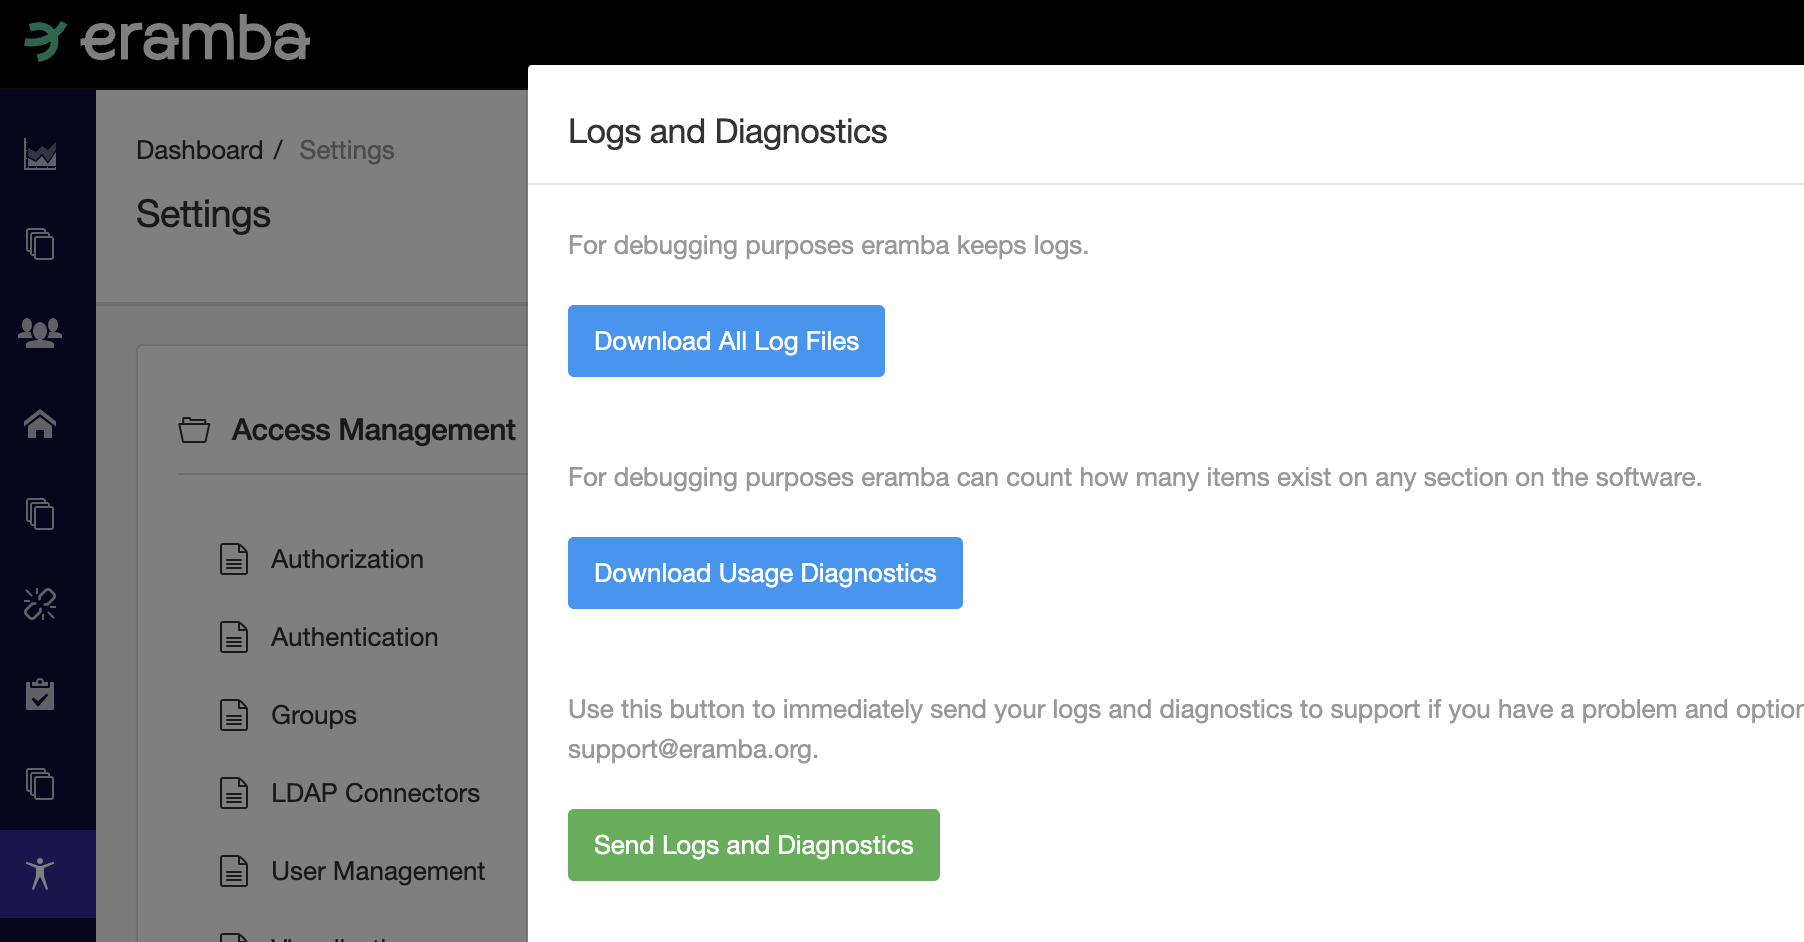
The interface allows you to click and download a zip file with all logs, you will find the following files:
- access.log: Nginx access type of logs, the domain name used on the requests is masked with "***"
- authentication.log: who access eramba, the user is masked with "***" where only the first and last letter of the account can be seen.
- authorization.log: all actions done by users logs here
- backup_restore.log: backup and restore logs
- cli-debug.log: cli commands run log
- cli-error.log: same as above for errors
- cron_daily.log: crontab logs
- cron_hourly.log: same as above
- debug.log: low level debug cakephp logs
- diagnostics/config.log: internal application logs
- diagnostics/migrations.log: same as above
- diagnostics/mysql_general.log: database logs
- diagnostics/mysql_tables.log: database logs
- diagnostics/mysql_variables.log: database logs
- diagnostics/php_info.log: php environmental logs
- diagnostics/system_health.log: eramba system health logs
- diagnostics/system_info.log: server system logs
- error.log: cakephp error logs
- reports.log: logs created when reports are processed and generated
- system_health_status.log: logs used to determine if the system log has issues or not
The logs described above can also be accessed if the customer has access to the eramba container.
Access eramba container
docker exec -it eramba bash
Navigate to logs folder
/var/www/eramba/app/upgrade/logs